SPP DISIS 2024 Phase 1: $30B in Upgrade Costs Across 260 Projects
On March 13, 2026, Southwest Power Pool (SPP) posted Phase 1 study results for the DISIS 2024 cluster. With 260 projects representing 66.5 GW of proposed generation capacity, DISIS 2024 is the largest interconnection cluster in SPP history, nearly double the size of the 2023 DISIS in both project count and capacity.
The Phase 1 results reveal a total of $30.2 billion in allocated network upgrade costs across the cluster, with a median cost assignment of $375/kW. Developers in this cluster now have 15 business days to determine whether to proceed in the queue or withdraw their request. Based on historical SPP withdrawal patterns, substantial attrition is likely.
DISIS 2024 Cycle Overview
The cluster's unprecedented size is partly by design. The application window was extended by roughly five months following SPP's FERC waiver request. The extension, combined with strong developer interest, produced a cluster more than twice the size of any prior cycle, and the pre-Phase 1 withdrawal rate had already exceeded 30% before a single cost assignment was posted.
Gas comprises the largest share of total active capacity at 17.7 GW across 33 projects. Solar (62 projects, 13.9 GW) and battery storage (74 projects, 13.9 GW) are nearly identical in total capacity. Solar + battery hybrids comprise 43 projects and 10.3 GW. Wind, historically a major resource type in SPP, accounts for just 32 projects and 9 GW, its smallest share of any recent DISIS cluster.
Phase 1 Cost Results
The Phase 1 results reveal a wide dispersion in cost assignments. The median total allocated cost is $375/kW (25th-75th percentile: $205/kW to $816/kW). Mean costs are driven upward by 37 projects assigned above $1,000/kW, with 2 exceeding $2,000/kW. Only about 47 projects were allocated costs below $150/kW, a range associated with low attrition in prior SPP cycles. The roughly 100 projects above $500/kW face materially higher withdrawal risk.
ERIS network upgrades account for roughly 86% of the $30.2B total. POI costs represent an additional 11%. The incremental cost of NRIS service is under 3%, indicating that the ERIS/NRIS decision has limited cost implications at this stage.
Interactive cost breakdowns by technology, ERIS vs NRIS comparisons, and project-level risk ratings.
Full Report — $995What's Driving the Costs
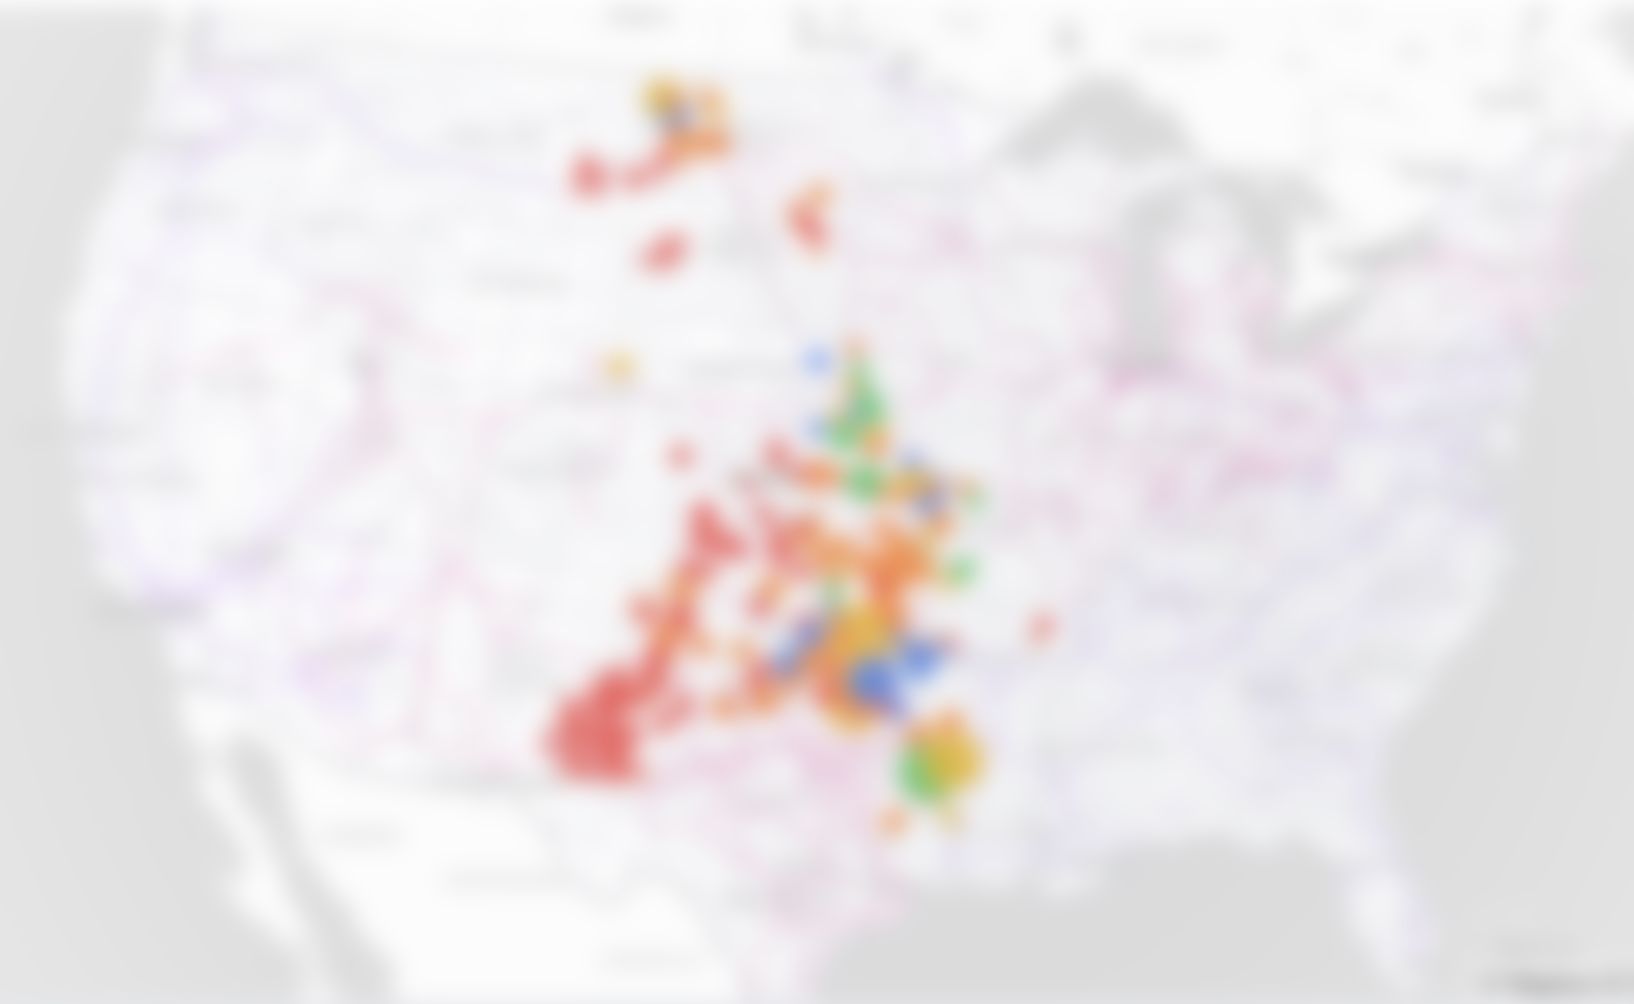
The costliest upgrades are new 765kV and 345kV high-voltage transmission lines across western Oklahoma, Kansas, and the Texas Panhandle. The six most expensive upgrades alone account for $6.5 billion (22% of the $30.2B cluster total) and each affect between 39 and 53 projects. All 44 projects allocated costs from the $1.3B Woodward-Crawfish Draw 765kV line are solar, wind, or hybrid configurations.
Interactive cost map, searchable upgrade explorer, and project lookup for all 260 projects.
Full Report — $995Regional Risk Profiles
The geographic distribution of costs across the SPP footprint reveals distinct regional risk profiles. Projects in the western Oklahoma and Texas Panhandle corridor face the highest cost allocations, driven by the need for major new 765kV transmission infrastructure. Eastern SPP projects, particularly gas-fired generation near load centers, face significantly lower costs.
Interactive Geographic Cost Map
Based on historical SPP withdrawal patterns, projects assigned above $500/kW have experienced withdrawal rates exceeding 90%. In the DISIS 2024 cluster, roughly 100 projects fall into this category. The interactive Attrition Scenario Tool in the full report models how withdrawal rates by cost bucket could reshape the cluster across multiple scenarios, and the Risk Distribution analysis assigns Low, Medium, and High risk ratings to every project based on technology-specific cost thresholds calibrated to historical outcomes.
NRIS-to-ERIS conversion rates by Decision Point 1 will be an early signal of developer sentiment. Post-Phase 1 withdrawal rates by resource type will indicate whether gas projects continue to tolerate higher costs than renewables. The full report provides the project-level data and interactive tools to track these dynamics as they unfold.
Includes interactive charts, project-level data, and scenario tools
Methodology
Cost data is sourced from SPP's publicly posted DISIS 2024 Phase 1 Powerflow and Short Circuit Draft Report workbook (posted March 13, 2026). Project capacity and queue metadata is sourced from SPP's Generator Interconnection queue, maintained by interconnection.fyi. Cost per kilowatt ($/kW) is calculated as total allocated cost divided by nameplate capacity in kW.
Interconnection queue requests/projects in list format
All transmission grid interconnection queue requests/projects All distribution grid (DG) interconnection queue requests/projects Data center projects by state EIA860 planned and operational power plant projectsInsights
Charts State of interconnection queues — January 2024In 2024, interconnection queues shrank for the first time in yearsAll insightsOther energy & climate tools
Inflation Reduction Act Bill Text Viewer ToolClimate Tech Jobs Tracker (30,000+ jobs)Climate Tech Hiring Trends & ChartsBuy/Sell Surplus TransformersQueue requests/projects by country
Queue requests/projects by power market
Queue requests/projects by status
Queue requests/projects by cluster
Queue requests/projects by U.S. state
Queue requests/projects by Canadian province
Data Centers
All data center projectsBy U.S. State
Interconnection queue requests/projects by transmission owner
Interconnection queue requests/projects by year
Queue requests/projects in 2026Queue requests/projects in 2025Queue requests/projects in 2024Queue requests/projects in 2023Queue requests/projects in 2022Queue requests/projects in 2021Queue requests/projects in 2020Queue requests/projects in 2019Queue requests/projects in 2018Queue requests/projects in 2017Queue requests/projects in 2016Queue requests/projects in 2015Queue requests/projects in 2014Queue requests/projects in 2013Queue requests/projects in 2012Queue requests/projects in 2011Queue requests/projects in 2010Queue requests/projects in 2009Queue requests/projects in 2008Queue requests/projects in 2007Queue requests/projects in 2006Queue requests/projects in 2005Queue requests/projects in 2004Queue requests/projects in 2003Queue requests/projects in 2002Queue requests/projects in 2001Queue requests/projects in 2000Queue requests/projects in 1999Queue requests/projects in 1998Queue requests/projects in 1997Queue requests/projects in 1996Queue requests/projects in 1995© 2026 Interconnection.fyi. All rights reserved.
GridTracker by Interconnection.fyi
Full access to the data
See all the data
Find relevant dockets and filings
Track data center builds